Marketing Cloud Intelligence: All-in-one Reporting System
Have you ever wanted great reports and beautiful dashboards to view the performance of your campaigns at a glance?
Salesforce Marketing Cloud introduced Intelligence Reports, a new addition to get the reports you wanted all along. Here, we will give you an introduction to this powerful tool.
What Is the Intelligence Reports Tool?
The Intelligence Reports tool is powered by Marketing Cloud Intelligence. It’s the leading marketing intelligence platform that lets you connect your data to all sorts of different sources, uncovering deep marketing insights and campaign performance. Intelligence Reports is a new tool to generate, view, and share a complete and thorough analysis of your email, push, and journey campaign-level data. You can enhance performance and increase engagement with your customers using the tools available in Intelligence Reports.
- Dashboards: Easily analyze your results in a glance, and make informed, data-driven decisions with prebuilt dashboards that visualize email, push, and journey campaign-level data up to the campaign name.
- Pivot tables: Make your own pivot reports to study, summarize, and transform your data so you can determine associations, trends, and patterns.
- Scheduled reports: Analyze, view, and share your reports with your team. You can easily schedule and share reports via Excel, CSV, and text, as well as visual formats like PowerPoint, PDF, and PNG.
Get Started with Intelligence Reports
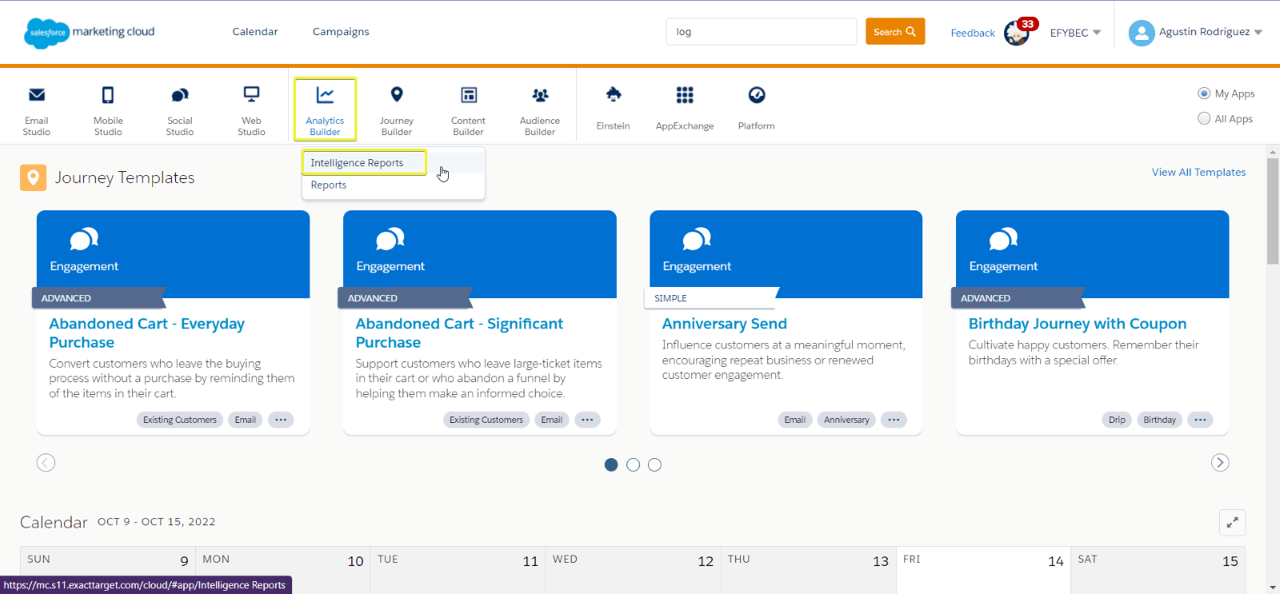
The Intelligence Reports tool is just a few clicks away. You can access Intelligence Reports by hovering over the Analytics Builder tile and selecting Intelligence Reports from the menu.
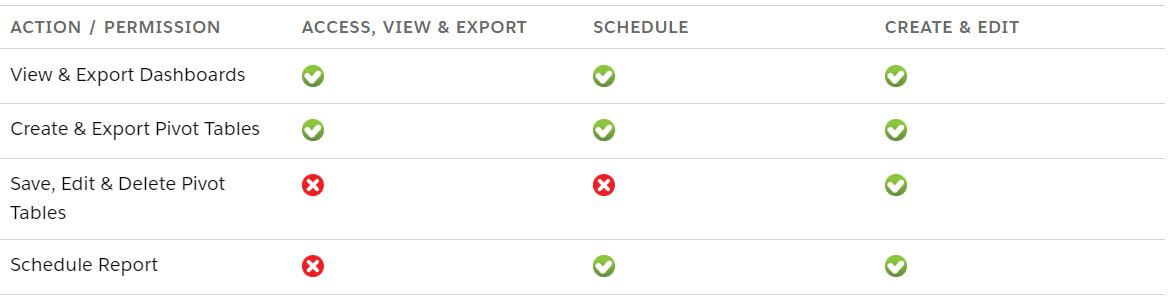
The Intelligence Reports tool is centered on roles and permissions, meaning you can make specific actions depending on your assigned permissions and user role.
The following table explains what you can do on each permission and the actions you can perform per permission:
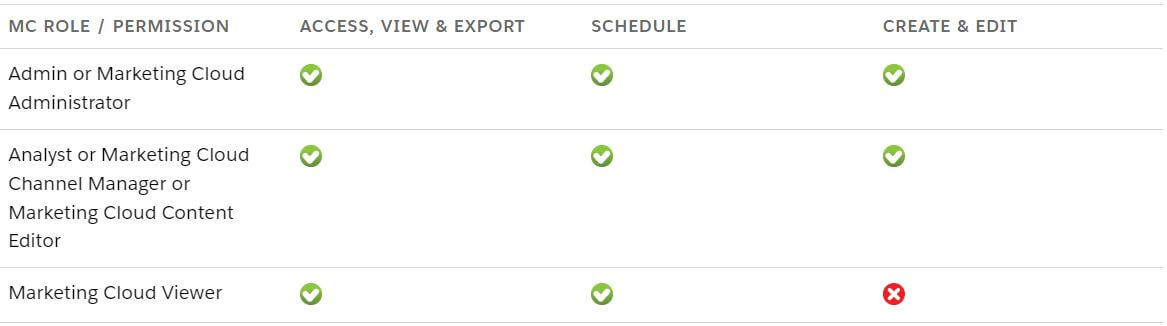
The following chart shows how each permission affects the different Salesforce Marketing Cloud user roles:
What Data Can I See?
The Intelligence Reports tool shows email, push, and journey campaign-level data. (It doesn’t display subscriber-level or event-level data.) The data you can retrieve is daily accumulated metrics. For example, you can view the number of sends and opens per day, for the last 30 days, on a specific campaign.
There are two types of data elements available: dimensions and measurements.
- Dimensions: Qualitative, non-numeric data (data you can’t count), such as campaign name, campaign ID, and so on
- Measurements: Quantitative, numeric data (data you can count), such as the number of clicks, emails opened, and so on.
Now that you’re familiar with Intelligence Reports, let’s move on to the next section to learn more about dashboards.
Type of Dashboards.
The Intelligence Reports tool shows email, push, and journey campaign-level data. (It doesn’t display subscriber-level or event-level data.) The data you can retrieve is daily accumulated metrics. For example, you can view the number of sends and opens per day, for the last 30 days, on a specific campaign.
- Email Overview: Provides a high–level overview of email campaigns, such as the number of emails sent, open rate, and so on
- Email Deliveries: Provides a detailed visualization of email delivery data, such as delivery KPIs, including sends, deliveries, bounces, and delivery schedules, and detailed breakdowns by domain, day of the week, and audience
- Email Performance: Provides a detailed visualization of email performance data, such as email send data, including open rate, click rate, unsubscribe rate, and performance funnels, and detailed breakdowns by domain, day of the week, and audience
- Journey Performance by Email: Provides detailed insights into journey and activity data, including journey performance, and detailed breakdowns by domain, day of the week, and audience.
- Push Deliveries: Provides a detailed visualization of push delivery data, including push notification delivery data and timelines, and a breakdown by day of the week, cell phone OS, and mobile app
- Push Participation: Provides details on key performance indicators (KPIs) for push notifications, including deliveries, opens, and open rates, and breakdowns by day of the week, mobile OS, and mobile app
- Journey Performance by Push: Provides details on the performance data for journeys and push notifications, and breakdowns by day of the week, mobile OS, and mobile app
- Push Performance: Provides details on overall push performance, including push sends, opens, bounces, and deliveries, and a breakdown by day of the week, mobile OS, and mobile app
Let’s follow along on how to use these dashboards to analyze and improve campaigns.
Put Dashboards to Work
You can use two predefined dashboards to focus on campaign performance: Email Deliveries and Email Engagement. Let’s start with the Email Deliveries dashboard.
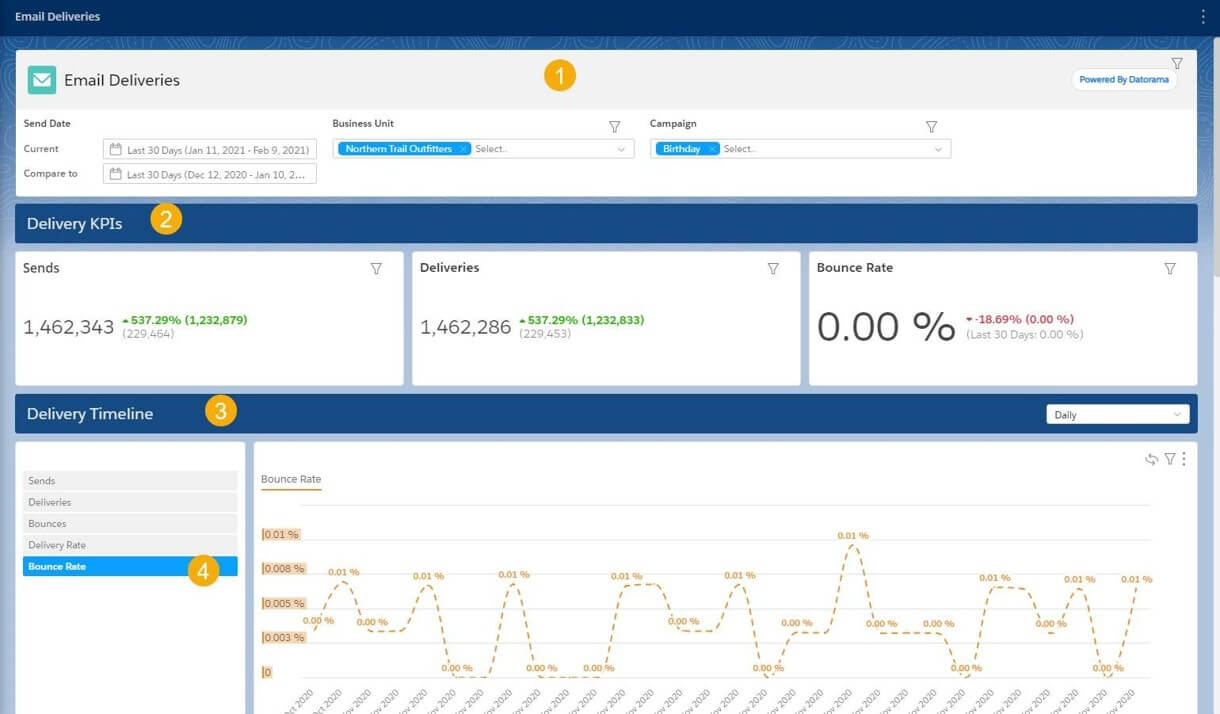
You can filter by the Email Deliveries dashboard (1) to focus on the relevant information by filtering by business unit (e.g., Northern Trail Outfitters) and campaign (e.g., birthday). You can see the delivery KPIs, including dispatches, deliveries, and bounce rate, and notice that dispatches and deliveries have increased, while the bounce rate has decreased (2). In the delivery timeline (3), use the interactive filters to focus the data on a specific measurement, such as bounce rate, so you can see trends over time (4).
You can also take a look at the Email Engagement dashboard to see how your users engaged with an email.
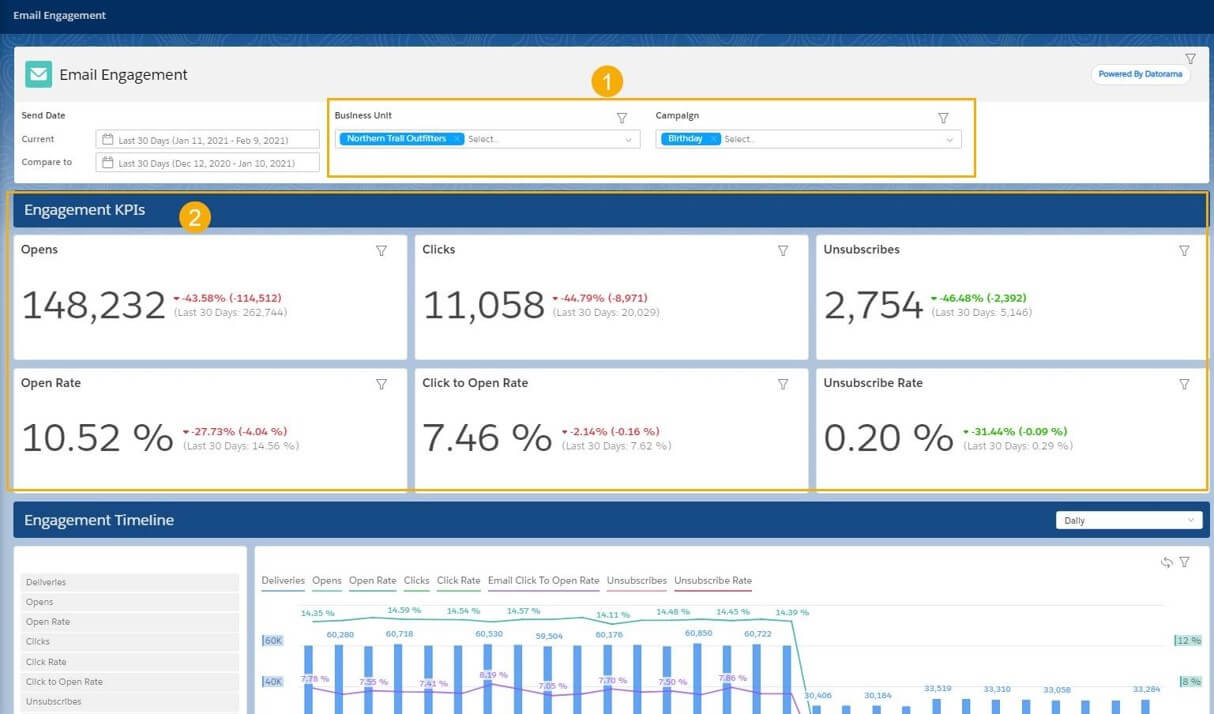
As soon as you click on the dashboard, it is automatically filtered for you because the filters are automatically saved – even if you switch between different dashboards (1). Here, you can focus on the most important engagement KPIs (2), such as open rate and click-through rate. You can also scroll down and see which day of the week the open rate was highest, which helps you plan future mailings.
Share Your Dashboards
If you want to share a dashboard with others or create a report to be scheduled and delivered, then you can use the share option. This option allows you to:
- Share via Slack: This option shares a dashboard page or widget directly to Slack.
- Share via Email: This option shares a dashboard page or widget via email.
- Download: This option downloads a local file of a dashboard page or widget, either as a PNG, Excel, PDF, or PPT file format.
- Create scheduled reports: This option creates a report with the dashboard that can be set to run as part of a workflow in real-time, or according to a defined schedule. We cover scheduled reports in more detail in the final unit. .
Conclusion
Keeping track of your campaigns just got a whole lot easier! With Marketing Cloud Intelligence Reports, you can track at a glance all your campaigns in one place. An easy-to-use interface lets you quickly create detailed reports and review metrics on dashboards for a comprehensive insight into your marketing performance.
Say goodbye to siloed data and hello to a single-view campaign with Intelligence Reports.
Go beyond pre-built dashboards. If you’re looking for more flexibility you should consider upgrading to Intelligence Reports for Engagement Advanced, which allows you to build custom dashboards, create custom KPIs and cross-channel views, and use Einstein (AI) Marketing Insights among other features.
Need help? We got you covered. Our certified experts provide custom implementations tailored to fit your business needs, making sure you get the most out of your Intelligence Reports.
Get started now! Contact us at info@devsutd.com or fill out this form by clicking here. We’ll get back to you soon!